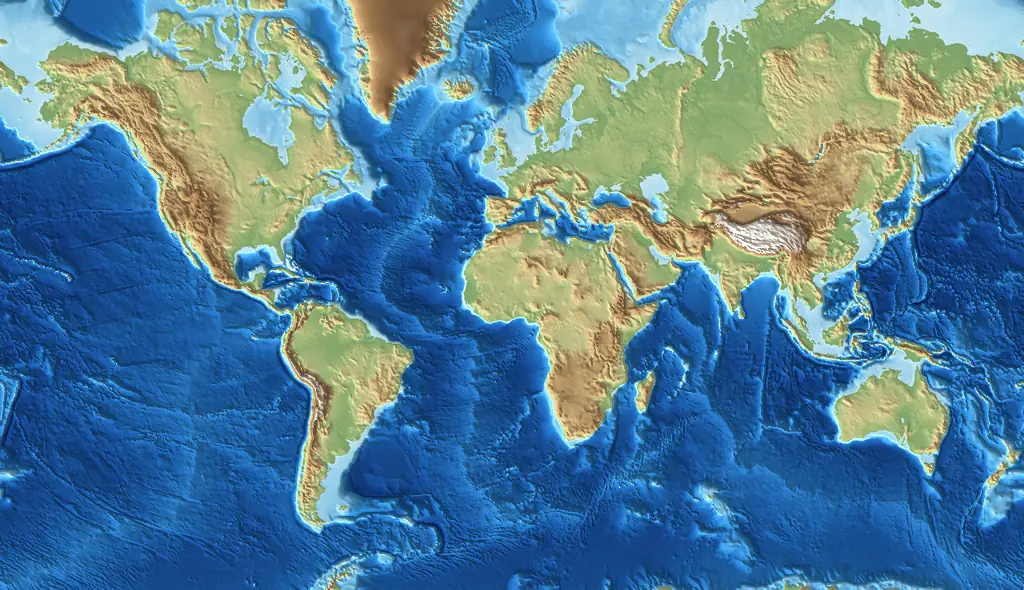
Arctic Ocean at a glance
- 2,306 maverage depth
- 2,606 mmedian depth
- 5,441 mmaximum depth
- 5.1 million km²water area
Arctic Ocean is one of the world's five oceans. Inside its outline the GEBCO grid has about 5.1 million km² of water, with an average depth of about 2,306 m (the middle value is 2,606 m) and a maximum of 5,441 m, found at 84.69° N, 3.75° E.
Open the map at the deepest cell and tap to read the depth.
How deep is each part of the Arctic Ocean?
The bar splits the Arctic Ocean's water by depth. Each colour is a depth band, and the shares add up to 100%.
- 0 to 200 m: 13.1%
- 200 to 1,000 m: 12.6%
- 1,000 to 4,000 m: 66.8%
- 4,000 to 6,000 m: 7.5%
- below 6,000 m: 0%
Named features near the deepest point: Gakkel Ridge (93 km), Morris Jesup Ridge (309 km), Litke Deep (320 km), Karasik Seamount (500 km).
Philippine Sea lists 10,931 m; Arabian Sea lists 9,536 m; Coral Sea lists 9,142 m; Tasman Sea lists 6,281 m; Sargasso Sea lists 7,761 m; Caribbean Sea lists 8,293 m; Bering Sea lists 7,043 m; Greenland Sea lists 5,559 m; Solomon Sea lists 8,949 m; Banda Sea lists 7,602 m; Celebes Sea lists 5,885 m; Ceram Sea lists 5,711 m; Great Australian Bight lists 5,981 m; Gulf of Alaska lists 5,479 m, more than the 5,441 m here, because the sea and ocean outlines overlap and are drawn separately.
The Arctic Ocean if sea level dropped
The slider on the map lowers the sea in steps. This table shows how much of the Arctic Ocean's water would be land at each step.
| Sea level lowered by | Becomes land | Share of its water |
|---|---|---|
| 10 m | 3,866 km² | under 0.1% |
| 20 m | 11,076 km² | 0.2% |
| 50 m | 161,895 km² | 3.1% |
| 80 m | 387,620 km² | 7.5% |
| 120 m | 501,791 km² | 9.8% |
| 200 m | 674,519 km² | 13.1% |
| 500 m | 1.1 million km² | 20.6% |
| 1,000 m | 1.3 million km² | 25.7% |
| 2,000 m | 2 million km² | 38.7% |
| 3,000 m | 3 million km² | 58.7% |
| 4,000 m | 4.8 million km² | 92.5% |
| 6,000 m | 5.1 million km² | 100% |
A simple bathtub model: it lowers the sea everywhere by the same amount and does not simulate how water would really drain.
The biggest seas
- Philippine Sea 5.6 million km², up to 10,931 m
- Arabian Sea 4.1 million km², up to 9,536 m
- Coral Sea 4 million km², up to 9,142 m
- Tasman Sea 3.3 million km², up to 6,281 m
- South China Sea 3.1 million km², up to 5,232 m
- Sargasso Sea 3 million km², up to 7,761 m
- Caribbean Sea 2.8 million km², up to 8,293 m
- Bering Sea 2.2 million km², up to 7,043 m
- Mediterranean Sea 1.6 million km², up to 5,030 m
- Norwegian Sea 1.5 million km², up to 4,057 m
Seas lie inside or beside the oceans, so their areas overlap with the ocean figures. All oceans and seas
Frequently asked questions
How deep is the Arctic Ocean?
On average about 2,306 m in the GEBCO grid (the middle value is 2,606 m). The deepest cell inside its outline is 5,441 m, at 84.69° N, 3.75° E.
How big is the Arctic Ocean?
About 5.1 million km² of water inside its Natural Earth outline, counted from the grid cells that are below sea level. Marginal seas lie inside the ocean outlines, so the areas of the oceans and seas overlap and should not be added together.
How much of the Arctic Ocean would be land if sea level dropped?
With the sea 50 m lower, about 161,895 km² (3.1%) of its water would be land. At 6,000 m lower, 100% would be. This is a simple bathtub model that lowers the sea evenly everywhere.
Data: depths from the GEBCO_2026 grid, statistics worked out inside the Natural Earth outline of the ocean. See data sources and licences. The GEBCO Grid should NOT be used for navigation or for any other purpose involving safety at sea.