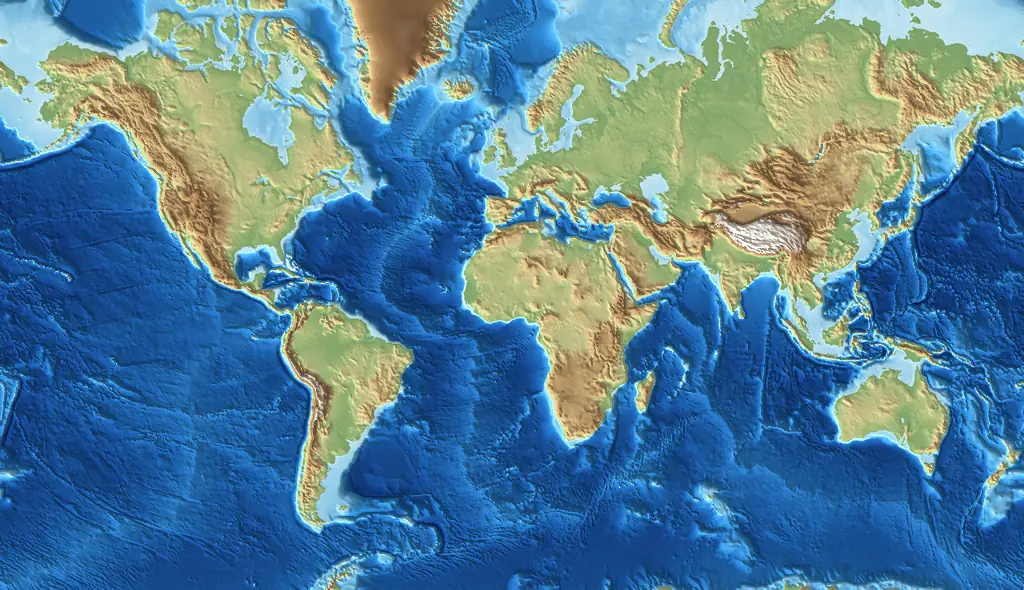
How deep is the ocean?
The deepest point in the GEBCO grid behind this map is Challenger Deep, 10,927 m below sea level, at 11.37° N, 142.60° E in the Pacific. The single deepest cell anywhere in the grid reads 10,931 m, in the Mariana Trench. Both figures come from the same grid, and values quoted elsewhere differ by tens of metres because they come from different surveys: Wikidata gives 10,984 m for Challenger Deep.
Most of the ocean is far shallower than that. Weighting each of the five oceans by its area, the average depth is about 4,085 m. 71% of the Earth's surface is below sea level in the grid.
| Ocean | Average depth | Maximum depth | Water area |
|---|---|---|---|
| Pacific Ocean | 4,315 m | 10,927 m | 139.1 million km² |
| Atlantic Ocean | 3,883 m | 8,824 m | 71.6 million km² |
| Indian Ocean | 4,036 m | 7,337 m | 60.4 million km² |
| Southern Ocean | 3,756 m | 7,285 m | 16.4 million km² |
| Arctic Ocean | 2,306 m | 5,441 m | 5.1 million km² |
Areas and averages are worked out inside the Natural Earth ocean outlines from the full-resolution grid. Maximum depth is the deepest cell in each outline. The Philippine Sea lists 10,931 m, a little more than the Pacific's 10,927 m, because the two outlines overlap and are drawn separately.
It helps to picture a scale. Take the highest ground in the grid, 8,627 m above sea level, and set it down on the bottom of the Mariana Trench. Its top would still be about 2,300 m under water. Sunlight only reaches the top of the sea, so almost all of the ocean by volume is cold, dark and under enormous pressure, and most of what lies down there has never been seen by people.
The ocean floor is not flat. Wide, gently sloping continental shelves run out from the coasts, then the seabed drops away to vast flat plains, with mountain chains, trenches and single undersea mountains rising from or cutting into them.
The deepest places in the ocean
Trenches are the deepest places in the sea. The deepest trenches in our list of 39, by the deepest cell the grid finds in each, are:
- Mariana Trench 10,931 m
- Tonga Trench 10,755 m
- Philippine Trench 10,090 m
- Kermadec Trench 10,050 m
- Yap Trench 9,918 m
- Izu-Ogasawara Trench 9,841 m
The Mariana Trench map and the Challenger Deep map have the full story for the deepest of them. Among the seas, the deepest are Philippine Sea (10,931 m), Arabian Sea (9,536 m), Coral Sea (9,142 m), Solomon Sea (8,949 m) and Caribbean Sea (8,293 m). All undersea features · All oceans and seas
Drain the oceans: how sea level changed the map
The slider under the map lowers the sea step by step, from today's level down to 6,000 m lower. At each step the map shows the land that would be dry, and below it the figures for that step. A drop of 120 m is roughly the lowest sea level of the last Ice Age, when so much water was locked up in ice sheets: about 21.7 million km² of seabed becomes land, which is 14.8% of today's land area. The floor of the North Sea is dry from 50 m, and 416,596 km² of the North Sea's 492,936 km² is land at 120 m. This is the land called Doggerland. It joined Britain to the rest of Europe and was flooded as the ice sheets melted after the last Ice Age.
Doggerland is not the only land bridge on the map: 10 of the 10 places we checked, from the English Channel floor to Beringia and Sahul, are dry at 120 m lower. People and animals could once walk between places that the sea now separates.
Keep lowering the sea and the map changes quickly. At 2,000 m lower 58 million km² of seabed has become land, and by 4,000 m lower only 53% of today's sea remains. Each step has its own page, starting with the Ice Age at 120 m and ending with the oceans drained to 6,000 m. All sea level steps
This is a simple bathtub model. It lowers the sea everywhere by the same amount and does not simulate how water would really drain. Inland lakes stay water, and basins below sea level on land (such as Death Valley) stay land.
How the seabed is mapped
Ship surveys are the gold standard. Modern ships carry multibeam sonar, which sends a fan of sound pulses to the seabed and times the echoes, drawing a strip of detailed map beneath the ship as it goes. But the ocean is enormous and ships are slow, so only a fraction of the seafloor has been mapped in this kind of detail. We do not quote a percentage here because the figure keeps changing as new surveys are added and is not part of the GEBCO data we use. The gaps are mostly in remote parts of the ocean, far from shipping lanes and coasts.
To fill the gaps, scientists use satellites that measure the height of the sea surface very precisely. The sea is not perfectly level: it rises into a very slight bulge over an undersea mountain, because the extra rock pulls water towards it, and dips over a trench. Turning those bumps into depths gives a picture of the whole seabed, but a blurry one that cannot show anything much smaller than a few kilometres across.
The data comes from GEBCO, the General Bathymetric Chart of the Oceans, a project that gathers ship surveys from around the world and blends them with the satellite estimate to make one grid. The release used here is GEBCO_2026, published in April 2026. The credit line and licence are on the data sources page.
How to read the colours and the slider
The colours show the height of the ground. Pale blue is shallow water, such as the shelves around coasts. The blue deepens as the sea gets deeper, and the darkest navy is the deepest trenches. Land is shown in green, then brown and finally white on the highest ground, so you can see coasts, shelves and mountains on one map. Tap or click anywhere to read the depth at that point, and the nearest named feature.
The drain slider lowers the sea in 12 steps (10, 20, 50, 80, 120, 200, 500, 1,000, 2,000, 3,000, 4,000 and 6,000 m below today's level). At each step the seabed that would be dry appears as sand-coloured land, and the figures below the slider tell you how much land that adds.
Undersea mountain ranges
The longest mountain chains on Earth are under the sea. Mid-ocean ridges, where new seafloor is made, wind through every ocean. The biggest in our list are Mid-Atlantic Ridge, East Pacific Rise, Central Indian Ridge and Lomonosov Ridge. A ridge has no single depth, so each page shows the depth at its listed point and says so. Seamounts, which are single undersea mountains, are listed with the depth of their summits. Examples include Tamu Massif (3,179 m to the summit), Kama‘ehuakanaloa Seamount (1,033 m to the summit) and Marsili (550 m to the summit).
On the map, look for the long, pale lines of ridges running through the middle of an ocean and the dark, narrow slots of trenches near the edge of the Pacific.
Ancient seas and marine reptiles on the Dinosaur Fossil Map →
How accurate is this ocean floor map?
The figures on the pages come from the full grid, with a value every 15 arc-seconds (about 460 m at the equator). The map you drag around uses tiles that are coarser, about 1.2 km a pixel at the equator when zoomed in as far as it goes, so a very narrow trench or a sharp peak looks smoother on the map than in the grid. That means the true deepest points can read shallower when you tap them on the map. For the Challenger Deep, the map tile reads 10,875 m where the grid reads 10,927 m.
In the deep ocean far from ship tracks, the grid is partly an estimate, so treat it as a guide to the big picture rather than a survey. This map is for learning and curiosity only. The GEBCO Grid should NOT be used for navigation or for any other purpose involving safety at sea.
Frequently asked questions
How deep is the ocean?
The average depth of the five oceans is about 4,085 m, when each ocean is weighted by its area. The deepest point in the GEBCO grid used on this map is Challenger Deep in the Mariana Trench, 10,927 m below sea level. The table in the first section of this page lists the average and maximum depth of every ocean.
What is the deepest point in the ocean?
Challenger Deep, at the southern end of the Mariana Trench in the western Pacific. The grid reads 10,927 m there. Wikidata gives 10,984 m, and figures from different surveys differ by tens of metres, so treat any single figure as "about". Crewed submersibles have reached the bottom of Challenger Deep.
How much of the ocean floor has been mapped?
Only a fraction of the seafloor has been surveyed in detail by ships, and we do not quote a percentage because it changes every year and is not part of the GEBCO data we use. Most of the deep ocean in the grid is estimated from satellite measurements of the sea surface, which show large features but not small ones. Coasts, shipping lanes and survey areas are far better mapped than remote mid-ocean areas.
What is the Mariana Trench?
The Mariana Trench is a long, curved trench in the western Pacific Ocean, east of the Mariana Islands, where one tectonic plate sinks beneath another. Its deepest cell in the grid is 10,931 m below sea level, and its deepest point is Challenger Deep. The Mariana Trench map page has the full story.
What was Doggerland?
Doggerland was land that joined Britain to the rest of Europe when the sea was lower in the last Ice Age. It was flooded as the ice sheets melted. On the map, the middle of the North Sea (floor about 43 m below today's sea level) is dry land once the sea is lowered by 50 m, and 416,596 km² of the North Sea's 492,936 km² becomes land at 120 m. See the Doggerland page for the map.
What would happen if sea level dropped 120 m?
About 21.7 million km² of seabed would become land, which is 14.8% of today's land area. Most of it is shallow continental shelf, and 10 of the 10 land bridges we checked are dry, including Doggerland (North Sea), English Channel floor and Irish Sea floor. This is a simple bathtub model that lowers the sea everywhere by the same amount.
How is the ocean floor mapped?
Two ways. Ships send sound pulses down and time the echoes (sonar, and multibeam sonar that fans out across a wide strip), which gives sharp detail along the ship's track. Satellites measure the height of the sea surface, which bulges slightly over undersea mountains because of their extra gravity, and a computer turns those bulges into a map of the seabed. GEBCO combines the two.
Why do ocean depths differ between sources?
Surveys use different instruments, different corrections for the speed of sound in water, and different grids. A narrow trench can read tens of metres different between sources, or shallower on a coarser map. For Challenger Deep this site's grid reads 10,927 m, the map tile you tap reads 10,875 m, and the commonly quoted figure is 10,935 m.
Is this map safe for navigation?
No. As GEBCO says, the GEBCO Grid should NOT be used for navigation or for any other purpose involving safety at sea. Use official nautical charts for that.
Where does the data come from?
Depths and heights come from the GEBCO_2026 grid, published in April 2026 by the GEBCO Compilation Group, which is free to use with credit. Feature names come from Wikidata, outlines of seas from Natural Earth and towns from GeoNames. The data sources page has the full citation and licences.
Data credits: see all data sources and licences. Depths and heights: GEBCO Compilation Group (2026) GEBCO 2026 Grid (doi: 10.5285/4f68d5c7-45eb-f999-e063-7086abc036fa). The GEBCO Grid should NOT be used for navigation or for any other purpose involving safety at sea.